The National Survey on Drug Use and Health (NSDUH) includes questions for adults aged 18 or older to assess lifetime and past year major depressive episode (MDE).5 In NSDUH, MDE is defined using the diagnostic criteria set forth in the 4th edition of the Diagnostic and Statistical Manual of Mental Disorders (DSM-IV),6 which specifies a period of 2 weeks or longer during which there is either depressed mood or loss of interest or pleasure and at least four other symptoms that reflect a change in functioning, including problems with sleep, eating, energy, concentration, and self-image.7 NSDUH also asks respondents about their current employment situation and the type of occupation and industry in which they work. NSDUH defines full-time employed respondents as those who usually work 35 or more hours per week and who worked in the past week or had a job despite not working in the past week.
This issue of The NSDUH Report uses data from the combined 2004 to 2007 surveys to present estimates of past year MDE among full-time workers aged 18 to 64 by occupational category.
Combined data from 2004 to 2007 indicate that the prevalence of past year MDE among adults aged 18 to 64 was higher among the unemployed and those of "Other" employment status than among persons employed part time or full time (Table 1). Among adults aged 18 to 64, an estimated 12.7 percent of those who were unemployed and 12.7 percent of those in the "Other" group experienced an MDE in the past year compared with 9.3 percent of those employed part time and 7.0 percent of those employed full time.
Table 1. Past Year Major Depressive Episode (MDE) among Persons Aged 18 to 64, by Employment Status: 2004-2007 Combined
| Employment Status | Percent | Number in Thousands |
|---|---|---|
| Total | 8.6 | 15,531 |
| Full-Time | 7.0 | 8,143 |
| Part-Time | 9.3 | 2,277 |
| Unemployed | 12.7 | 911 |
| Other* | 12.7 | 4,200 |
| Source: SAMHSA, 2004, 2005, 2006, and 2007 NSDUHs. |
Reflecting the fact that over half of the adult population (64.3 percent) were employed full time, a majority of those who experienced an MDE in the past year also were employed full time. From 2004 to 2006, over half of all persons aged 18 to 64 who experienced a past year MDE (52.4 percent) were employed full time.
MDE, by Occupational Category
Among the 21 major occupational categories, the highest rates of past year MDE among full-time workers aged 18 to 64 were found in the personal care and service occupations (10.8 percent) and the food preparation and serving related occupations (10.3 percent) (Figure 1). The occupational categories with the lowest rates of past year MDE were engineering, architecture, and surveying (4.3 percent); life, physical, and social science (4.4 percent); and installation, maintenance, and repair (4.4 percent).
Figure 1. Past Year Major Depressive Episode (MDE) among Full-Time Workers Aged 18 to 64, by Occupational Categories**: 2004-2007 Combined
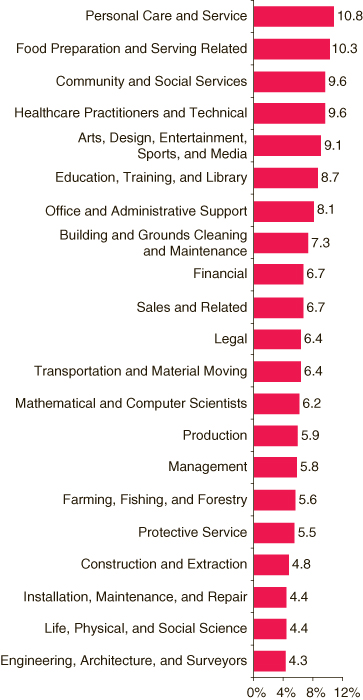
Figure 1 Table. Past Year Major Depressive Episode (MDE) among Full-Time Workers Aged 18 to 64, by Occupational Categories**: 2004-2007 Combined
| Occupational Categories | Percent |
|---|---|
| Personal Care and Service | 10.8% |
| Food Preparation and Serving Related | 10.3% |
| Community and Social Services | 9.6% |
| Healthcare Practitioners and Technical | 9.6% |
| Arts, Design, Entertainment, Sports, and Media | 9.1% |
| Education, Training, and Library | 8.7% |
| Office and Administrative Support | 8.1% |
| Building and Grounds Cleaning and Maintenance | 7.3% |
| Financial | 6.7% |
| Sales and Related | 6.7% |
| Legal | 6.4% |
| Transportation and Material Moving | 6.4% |
| Mathematical and Computer Scientists | 6.2% |
| Production | 5.9% |
| Management | 5.8% |
| Farming, Fishing, and Forestry | 5.6% |
| Protective Service | 5.5% |
| Construction and Extraction | 4.8% |
| Installation, Maintenance, and Repair | 4.4% |
| Life, Physical, and Social Science | 4.4% |
| Engineering, Architecture, and Surveyors | 4.3% |
| Source: SAMHSA, 2004, 2005, 2006 and 2007 NSDUHs. |
MDE, by Demographic Characteristics and Occupational Category
Among full-time workers aged 18 to 64, females were more likely than males to have a past year MDE (10.1 vs. 4.7 percent). The highest rates of past year MDE among female full-time workers aged 18 to 64 were found in the food preparation and serving related occupations (14.8 percent) and community and social service occupations (13.3 percent) (Table 2). The highest rates of past year MDE among male full-time workers aged 18 to 64 were found in the arts, design, entertainment, sports, and media occupations (6.7 percent). The lowest rates of past year MDE among both males and females were found in life, physical, and social science occupations (2.3 percent for males and 7.2 percent for females).
Table 2. Past Year Major Depressive Episode (MDE) among Full-time Workers Aged 18 to 64, by Demographic Characteristics and Occupational Categories**: 2004-2007 Combined
| Occupational Category | Gender | Age Group | ||||
|---|---|---|---|---|---|---|
| Male | Female | 18 to 25 | 26 to 34 | 35 to 49 | 50 to 64 | |
| Personal Care and Service | *** | 10.3 | 9.8 | 10.5 | 12.2 | 9.7 |
| Food Preparation and Serving Related | 5.4 | 14.8 | 11.5 | 9.0 | 11.9 | 5.6 |
| Community and Social Services | 4.4 | 13.3 | 10.3 | 15.6 | 7.4 | 8.3 |
| Healthcare Practitioners and Technical | 6.0 | 10.7 | 11.9 | 9.3 | 11.3 | 6.3 |
| Arts, Design, Entertainment, Sports, and Media | 6.7 | 12.5 | 7.5 | 13.5 | 7.2 | 8.0 |
| Education, Training, and Library | 6.3 | 9.6 | 8.8 | 8.4 | 11.7 | 5.4 |
| Office and Administrative Support | 5.2 | 9.3 | 10.9 | 8.9 | 8.2 | 5.9 |
| Building and Grounds Cleaning and Maintenance | 4.5 | 11.8 | 7.2 | 5.0 | 9.7 | 5.3 |
| Financial | 5.5 | 7.9 | 8.7 | 7.9 | 3.8 | 9.8 |
| Sales and Related | 4.2 | 10.0 | 10.1 | 9.1 | 5.9 | 3.6 |
| Legal | 4.6 | 8.2 | *** | 6.0 | 6.3 | *** |
| Transportation and Material Moving | 5.8 | 10.6 | 8.1 | 6.7 | 5.4 | 6.7 |
| Mathematical and Computer Scientists | 4.6 | 10.4 | 8.2 | 7.7 | 6.7 | *** |
| Production | 4.9 | 8.5 | 7.3 | 7.4 | 6.0 | 3.7 |
| Management | 3.3 | 9.5 | 10.2 | 7.4 | 5.4 | 4.8 |
| Farming, Fishing, and Forestry | 5.4 | *** | 11.0 | *** | 2.6 | *** |
| Protective Service | 3.5 | *** | 5.7 | 2.1 | 6.5 | *** |
| Construction and Extraction | 4.5 | *** | 4.5 | 4.7 | 5.3 | 4.0 |
| Installation, Maintenance, and Repair | 4.3 | *** | 5.1 | 3.8 | 6.3 | *** |
| Life, Physical, and Social Science | 2.3 | 7.2 | 4.3 | 4.9 | 6.1 | *** |
| Engineering, Architecture, and Surveyors | 3.3 | 11.1 | 6.9 | 2.5 | 4.5 | 4.6 |
| Source: SAMHSA, 2004, 2005, 2006 and 2007 NSDUHs. |
Full-time workers aged 18 to 25 were more likely to have a past year MDE than full-time workers in all other age groups (8.9 percent for those aged 18 to 25; 7.6 percent for those aged 26 to 34; 7.2 for those aged 35 to 49; and 5.1 percent for those aged 50 to 64). Among full-time workers aged 18 to 25, the highest rates of past year MDE were found in the health care practitioners and technical occupations (11.9 percent) and the lowest in the life, physical, and social science occupations (4.3 percent).


No comments:
Post a Comment